marketing analytics, business analytics, lead generation, Australian SEO, data strategy
Marketing Analytics vs Business Analytics for Service Firms
by raffiné studio

Most advice on marketing analytics vs business analytics starts with the wrong decision. It asks which discipline your firm should adopt, which platform to buy, or which dashboard your leadership team should review. For most Australian service firms, that's not the constraint.
The question is whether your data can connect a website visit to an enquiry, a booked call, a signed engagement and revenue. If it can't, a business intelligence platform will give you a polished view of uncertainty. The answer isn't to choose marketing analytics or business analytics. It's to identify the next data capability that will improve pipeline visibility and commercial decisions.
Dimension | Marketing analytics | Business analytics |
|---|---|---|
Primary focus | Campaigns, channels, audiences and acquisition | Finance, operations, customers and firm-wide performance |
Typical questions | Which source generated enquiries, and what did they cost? | Which clients, services and engagements create sustainable profit? |
Common KPIs | CAC, CPL, conversion rate, attribution-weighted pipeline and channel ROI | Gross margin, utilisation, customer lifetime value, churn and revenue per FTE |
Common tools | GA4, Search Console, Looker Studio, HubSpot and CallRail | Xero, Power BI, Tableau, SQL-based warehouses and finance systems |
Review rhythm | Weekly or monthly optimisation | Monthly, quarterly or strategic planning |
Main decision impact | Budget allocation, landing page tests and funnel improvements | Pricing, hiring, capacity, service mix and investment |
Shared territory | Lead-to-revenue attribution | Lead-to-revenue attribution |
Why This Is the Wrong Question for Most Service Firms
A Sydney buyers agency can report campaign performance accurately and still lack the answer that affects growth: which source produced its last profitable client? Mortgage brokers, accountants, law firms, property businesses and other professional services face the same gap. They can see clicks, form submissions and cost per lead, while the link to signed work disappears after the first conversation.
Tool selection is therefore the wrong starting point. Buying Power BI, Tableau or a larger CRM before fixing source fields, conversion events and sales-stage updates creates a reporting project, not a revenue system.
Practical rule: If your team still guesses where closed clients came from, skip enterprise reporting. Fix attribution hygiene first.
The Australian Bureau of Statistics provides the ABS Business Longitudinal Analysis Data Environment (BLADE) overview, which links tax, trade, intellectual property and survey data to track active businesses from 2001–02 to the present. Its scope shows the difference between firm-wide business analytics and campaign reporting. BLADE examines performance, innovation, competitiveness, job creation and productivity over time, rather than the result of one advertisement.
An SME does not need to recreate a national statistical environment. It does need commercial data that connects marketing, sales, finance and delivery.
Data maturity decides the first investment
A firm with strong enquiry volume but weak tracking should invest in marketing analytics first. A firm with dependable source attribution, but difficult pricing, delivery-cost or retention questions, is ready to add business analytics.
Use this sequence:
Identify the revenue gap: Find where lead-source information disappears between enquiry and closed work.
Fix the measurement layer: Standardise forms, call tracking, campaign parameters, CRM fields and offline conversion imports.
Choose the next decision system: Use marketing analytics when acquisition is unclear. Use business analytics when profitability or capacity is unclear.
Connect the two: Make revenue attribution the handover point between channel performance and firm-wide decisions.
Australian SMEs waste budget by building dashboards before they can trust the inputs. The right first investment depends on whether the business can already connect leads to revenue.
What Each Discipline Actually Does
Marketing analytics tracks customer and campaign data so a firm can improve acquisition decisions. UNSW Sydney's definition of marketing analytics connects the discipline with customer behaviour and marketing performance. For a service firm, that means measuring the path from first interaction to enquiry, including channel cost, audience response, landing page behaviour and lead quality.
It should answer practical questions:
Which Google Search campaign generated qualified enquiries?
What did each booked call cost?
Which suburb, audience or message produced the strongest response?
Did a landing page change improve enquiry quality?
How did channel performance compare with the firm's internal baseline?
The output should be a budget or execution decision, not another traffic report. If the firm cannot identify which sources produce worthwhile enquiries, marketing analytics comes first.
Business analytics connects the operating model
Business analytics combines information from marketing, sales, finance, delivery and customer records. Swinburne's business analytics specialisation covers business intelligence, visualisation, machine learning, predictive analytics and big data. That wider scope supports decisions about pricing, operations, capacity, service mix and financial performance.
A professional services firm can use it to examine:
Which engagement types produce acceptable margin after delivery time?
Which referral sources produce valuable long-term clients?
Where should the firm hire, automate or reduce manual work?
Did a website redesign improve qualified pipeline volume?
Is growth being delivered profitably by the existing team?
Business analytics earns priority once lead attribution is dependable and the harder question is commercial performance. It connects demand with revenue, cost, capacity and customer value.
The disciplines answer different questions
Marketing analytics asks, “What happened in acquisition, and what should we change?” Business analytics asks, “What does this mean for the firm's performance and future decisions?”
The distinction is a data maturity decision, not a choice between competing dashboards. Marketing analytics supplies evidence about demand, channels and conversion quality. Business analytics joins that evidence to revenue, delivery cost, operations and retention.
For an Australian SME, start with marketing analytics when leads cannot be traced to revenue. Add business analytics when attribution works but pricing, margin, capacity or service mix remains unclear. Then connect both through shared definitions, clear ownership and a common revenue measure. Without that handover, each discipline can produce polished reporting while the firm still cannot explain which activity created profitable work.
Side by Side Across KPIs, Tools and Decision Impact
The clearest distinction appears when you compare the decisions each discipline supports. Marketing analytics is designed to diagnose acquisition efficiency. Business analytics is designed to interpret performance across the organisation.
Dimension | Marketing Analytics | Business Analytics |
|---|---|---|
Primary KPIs | CAC, CPL, MQL-to-SQL conversion, attribution-weighted pipeline and channel ROI | Gross margin per engagement, utilisation, customer lifetime value, churn and revenue per FTE |
Data sources | GA4, Search Console, ad platforms, email systems, forms, landing pages, call tracking and CRM acquisition fields | Xero, CRM, finance systems, project records, delivery data, payroll, customer records and operational databases |
Typical tools | GA4, Looker Studio, HubSpot and CallRail | Xero, Power BI, Tableau and SQL-based warehouses |
Review rhythm | Weekly campaign checks and monthly budget optimisation | Monthly operating reviews and quarterly planning |
Decisions informed | Channel allocation, creative changes, landing page tests, audience targeting and follow-up triggers | Pricing, hiring, capacity, service mix, client retention and investment |
Main weakness | Can stop at channel metrics without proving commercial impact | Can show commercial outcomes without explaining which campaign caused them |
Shared territory | Revenue attribution from lead to client | Revenue attribution from lead to client |
A Sydney broker may use GA4 and CallRail to understand whether a paid search campaign creates calls. That doesn't prove the calls are profitable. Xero and a CRM may show revenue and client records, but without campaign identifiers, the firm can't diagnose the creative or keyword that created demand.
This is why revenue attribution is the overlap, not a minor reporting detail. Marketing analytics needs downstream sales and finance information to distinguish cheap leads from valuable clients. Business analytics needs upstream acquisition data to explain where growth came from.
The technical setup should reflect the decisions, not the other way around. Use Looker Studio for a practical marketing dashboard where channel data can be normalised against internal baselines and Australian benchmarks. For a broader decision layer, connect website, CRM, finance and pipeline information so leadership can assess whether a funnel change improved qualified pipeline volume.
If you're still defining the stages of a lead journey, start with a clear funnel-building framework before commissioning elaborate reporting. A dashboard can't correct an undefined funnel.
How Each One Plays Out in Buyers Agencies and Professional Services
Consider a Sydney buyers agency running Google Ads for off-market property searches. Its marketing analytics should separate cost per lead by suburb, creative and campaign intent. It should also track the path from advertisement to landing page, enquiry, phone call and booked consultation.
That information helps the agency reallocate budget. It doesn't, by itself, reveal whether a lead became a signed buyer mandate or generated a worthwhile commission.
The buyers agency example
Business analytics adds the commercial layer:
Commission per closed deal
Lead-to-client conversion by source
Time from enquiry to signed mandate
Client value by service type
Delivery capacity by active search
A suburb may produce expensive leads but valuable mandates. Another may produce cheap enquiries that consume staff time without progressing. Marketing analytics spots the cost difference. Business analytics determines whether the difference matters.
The mortgage broker example
A Melbourne mortgage broker tracking aggregator referrals needs marketing analytics to compare referral volume, enquiry rate and appointment behaviour. The broker might also examine campaign creative, landing page completion and source-specific booking rates.
Business analytics should then connect each source to commission, settlement outcomes, lead-to-client conversion and client value by referrer. A source that sends fewer enquiries may still deserve attention if its clients have stronger commercial value or create useful repeat and referral opportunities.
The practical problem appears when the referral source lives in one system, the appointment in another and the settled loan in a spreadsheet. Each report can look accurate in isolation while the combined story remains unreliable.
The accounting firm example
A mid-tier accounting firm measuring partner-led LinkedIn activity faces a different challenge. Marketing analytics can show content engagement, landing page visits, enquiries and booked conversations by partner or campaign. It can identify which message creates interest among business owners.
Business analytics must examine the resulting client mix, engagement profitability, service expansion and lifetime value by referrer. Partner-led activity may support advisory work, tax services or broader relationships, so a simple lead count can undervalue the channel.
Commercial test: A marketing report should explain what to optimise. A business report should explain what to prioritise. If neither report connects to signed work, the firm is measuring activity rather than pipeline.
Firms running both disciplines often end up with two dashboards that don't reconcile. The marketing view claims success through enquiries and cost efficiency. The business view sees unclear revenue contribution. The fix is a shared source definition, consistent lifecycle stages and a revenue record that travels back to the original acquisition event.
Why Data Maturity Is the Constraint for Australian SMEs
Australian SMEs can buy more analytics tools than their teams can use effectively. The constraint is rarely dashboard access. It is the gap between basic reporting and measurement that supports a commercial decision.
CPA Australia's 2025/26 survey found that Australian small businesses were the least likely among the surveyed Asia-Pacific markets to use social media for business. It also found that 44% generated more than 10% of revenue online, while 30% said technology investments improved profitability. The CPA Australia 2025/26 Australia market summary points to a practical gap. Firms are adopting digital tools, yet many still cannot connect that investment to profit.
Deloitte reported that two-thirds of SMBs use AI, while only 5% are fully enabled to realise its benefits. That finding reinforces the same operational problem: tools spread faster than the processes, ownership and data quality needed to produce value.
The minimum viable data stack
A service firm should answer three questions before buying a complex business intelligence environment:
Which source produced closed revenue?
What did acquisition cost after sales effort and follow-up?
Where does the funnel leak between enquiry and signed mandate?
If any answer depends on guesswork, fix the foundations first. Set clean CRM source fields, consistent UTM conventions, call tracking, defined pipeline stages, reliable conversion events and a process for recording offline outcomes. Marketing analytics comes first when lead sources cannot be tied to revenue. Business analytics earns priority once those records are reliable and the firm needs to allocate resources, price services or improve profitability.

Ipsos iris provides a standardised digital audience currency endorsed by IAB and covers more than 21 million Australians aged 14 and over across smartphone, PC/laptop and tablet devices, according to Ipsos iris in Australia. Its coverage of over 10,000 websites and more than 2,200 apps supports broader audience reach and cross-device analysis. Those capabilities matter for market-level planning, but service firms still need source-to-revenue records before audience data can improve commercial decisions.
Where AI Search Breaks the Old Boundary
AI-assisted discovery adds a touchpoint between visibility and contact. A buyer may ask ChatGPT, Gemini or Perplexity for a buyers agent in Sydney's Eastern Suburbs, see a business mentioned, then call without producing a conventional search click.
Last-click marketing analytics can miss that influence. Business analytics may capture the enquiry and eventual client value, yet still cannot show whether an AI answer shaped the decision. Australian SMEs therefore face an attribution gap between discovery and revenue.
The shift deserves a measurement plan. SME AI adoption reached 44% in February 2026, after 43% across the prior quarter. AI patent applications nearly quadrupled, while research publications more than doubled from 2015 to 2024, according to The Australian government's AI adoption insights. Those signals support tracking AI-assisted discovery as a commercial input, not treating visibility as the outcome.
Analysis of 115 Australian businesses found that AI-referred sessions grew year over year, while AI revenue share remained about 0.1% in ecommerce. The finding separates rising visibility from realised commercial value. AI mentions can increase before a firm can connect them to revenue.
Attribution needs a longer lineage
The measurement chain now includes:
AI discovery or citation exposure
Branded or direct search behaviour
Website visit or direct call
On-site engagement
Form completion or booked appointment
CRM stage progression
Signed engagement and closed revenue
AI impressions will not all be observable. Set up the signals that can be captured: self-reported source fields, branded search trends, referral data where available, CRM notes and consistent call outcomes. Review these alongside pipeline stages rather than forcing every enquiry into a neat channel label.
For a practical guide, read AI search optimisation for Australian businesses. The commercial test is straightforward: AI visibility should contribute to qualified discovery calls and revenue, or it remains a reporting vanity metric.
Which to Prioritise for Website and Funnel Optimisation
The recommendation depends on what your firm can already prove. Don't buy a business analytics layer because it sounds more strategic. Don't settle for campaign reporting when every client has significant commercial value.
Firm type | Invest first | Why | Sequence |
|---|---|---|---|
Buyers agencies with strong enquiry volume but weak revenue tracking | Marketing analytics | Faster gains usually come from clarifying channel, landing page and call performance | Fix attribution, optimise the funnel, then add business reporting |
Brokers handling high-value transactions | Business analytics | A missed or poorly followed-up lead can justify deeper source-to-revenue analysis | Map CRM sources to pipeline and revenue, then optimise campaigns |
Professional services firms with mixed client sizes | Marketing analytics first, then business analytics | Acquisition data needs structure before profitability and client value can be compared fairly | Standardise source data, connect signed work, then assess service mix and margin |
Firms with reliable source attribution and complex delivery economics | Business analytics | The next decision concerns pricing, capacity, profitability or hiring | Consolidate finance, CRM and delivery data, then feed acquisition insight into planning |
Buyers agencies need clarity before complexity
For buyers agencies, start with GA4, Search Console and call tracking if lead volume exists but closed-source data is unreliable. Track cost per booked call, call quality, suburb intent and the movement from enquiry to mandate. A CRM overhaul can wait until the basic acquisition path is visible.
Brokers need commercial linkage early
A broker selling high-value advice or finance services shouldn't judge acquisition on lead volume alone. Connect campaign and referral sources to CRM stages, pipeline velocity, appointment attendance and eventual revenue. That gives the business analytics layer a reason to exist and helps expose where follow-up, not advertising, is the constraint.
Professional services firms need sequencing
Law, accounting and consulting firms often have mixed client sizes and partner-led acquisition. Start by standardising marketing events and source records, then add client value, engagement margin and service expansion. A conversion-focused website design approach should support this sequence by making each meaningful action measurable, from enquiry through booked call.
The rule is the same across all three profiles: fix attribution, optimise the funnel, then automate reporting. Reversing that order gives you automated uncertainty.
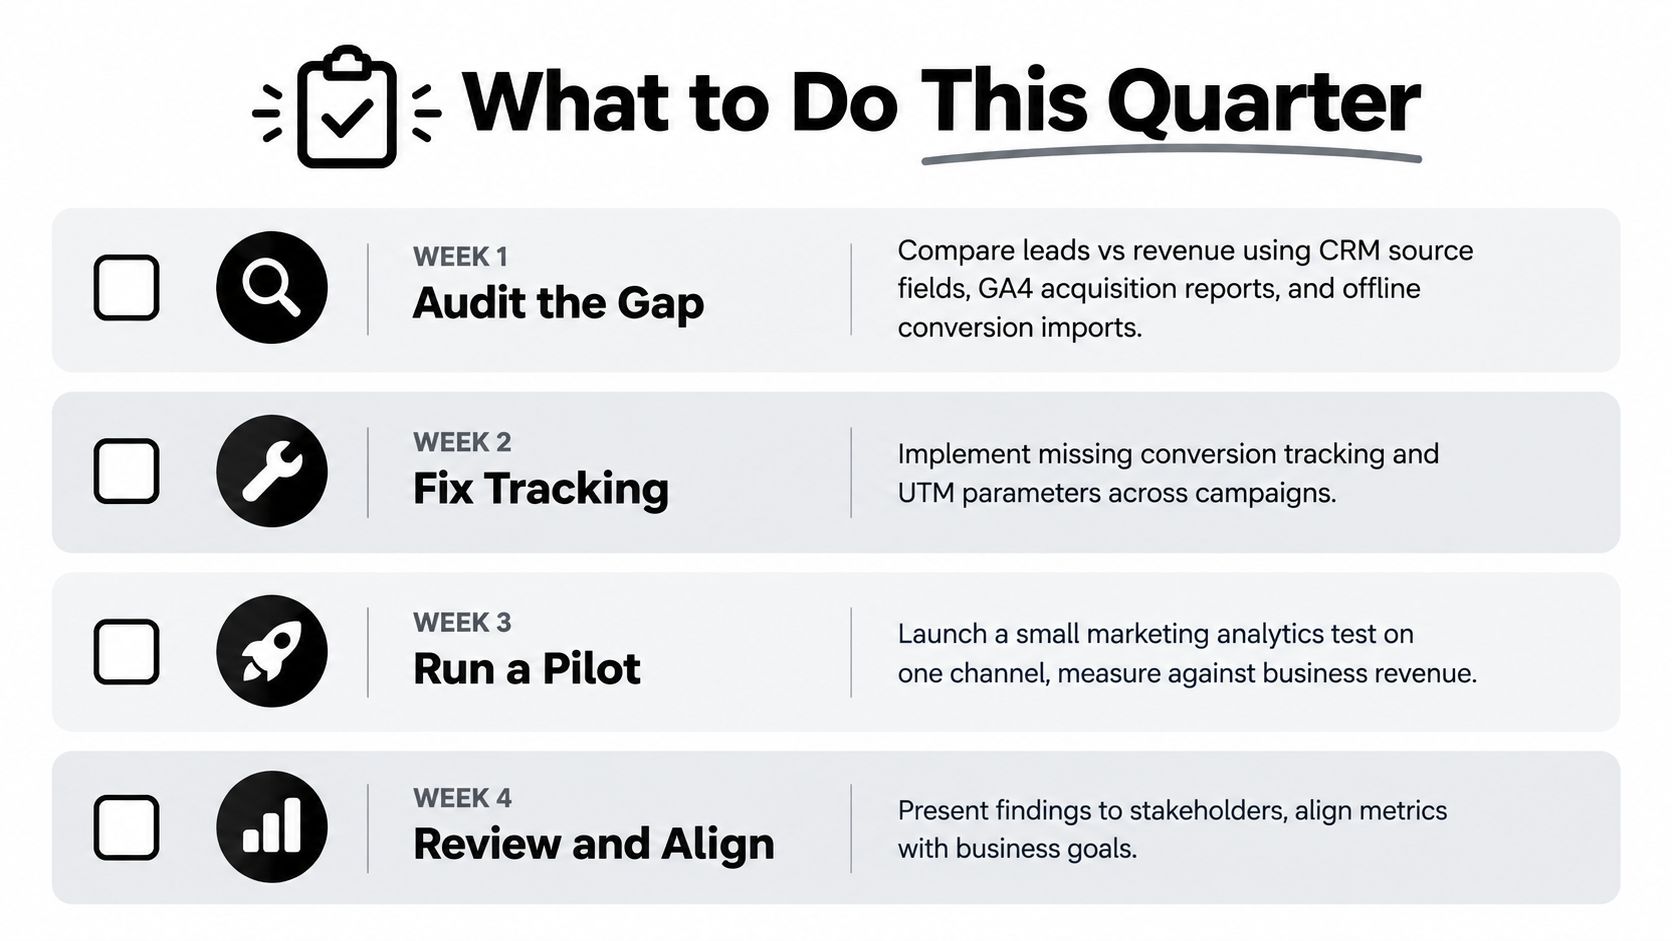
What to Do This Quarter
Use the next month to improve source-to-revenue visibility. You don't need a perfect data warehouse. You need a dependable view of the few events that affect pipeline.
Week one, audit the gap. Compare CRM source fields with GA4 acquisition reports and any offline conversion imports. Identify where an enquiry becomes a call, a proposal, a signed client or a lost opportunity.
Week two, fix tracking. Install or repair call tracking, confirm conversion events and standardise UTM parameters across paid search, social, email and partner campaigns. Make sure the team knows which source field they must complete and when.
Week three, build one pilot dashboard. Show cost per booked call, show rate and close rate by source. Those measures connect acquisition quality with commercial progression more effectively than a page of traffic metrics.
Week four, review and align. Decide whether marketing analytics or business analytics can deliver the next meaningful pipeline improvement. Then brief the people responsible for campaigns, sales, follow-up and delivery so everyone uses the same definitions.
For a visual summary of the workflow, watch this short video:
Raffine Studio helps Australian service firms connect conversion-focused websites, funnel tracking, CRM handoff, SEO and AI search visibility to qualified enquiries and booked calls. Visit Raffine Studio to review your current source-to-revenue setup and discuss which analytics layer should come first.